Hydrological Atlas of Switzerland – Plate 4.1

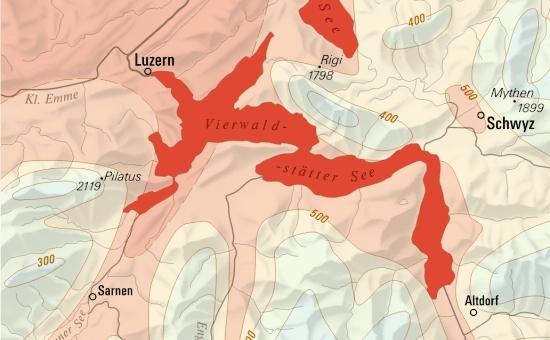

The 1:500 000 isoline map shows mean annual actual evaporation for the 20-year reference period in question. The evaporation pattern which emerges shows highly fragmented spatial differentiation due to a combination of the influences of climate, altitude and aspect, land-use and soil characteristics.
In digital form:
Plate of the Atlas as pdf (7074kb)
Explanatory text (taken without changes from the Hydrological Atlas)
Table «Mittlere jährliche aktuelle Verdunstungshöhen 1973 – 1992»
Georeferenziertes Shapefile (.zip) - 1672kb
Top (of page)