Hydrological Atlas of Switzerland – Plate 6.1

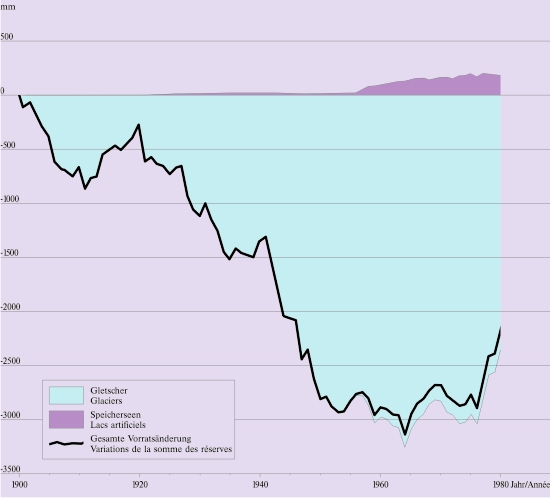
For the larger catchments (river basins) of Switzerland, all components of the water balance were calculated on a monthly basis for the period 1901 – 1984. To permit comparisons with other maps, all the average values refer to the period 1961 – 1980.
In digital form:
Plate of the Atlas as pdf (24384kb)
Explanatory text (taken without changes from the Hydrological Atlas)
Table «Wasserbilanz der Flussgebiete 1961–1980»
Table «Flussgebiet Nr. 1 Rhein, Felsberg»
Table «Flussgebiet Nr. 2 Thur, Andelfingen»
Table «Flussgebiet Nr. 3 Töss, Neftenbach»
Table «Flussgebiet Nr. 4 Ergolz, Liestal»
Table «Flussgebiet Nr. 5 Birs, Münchenstein»
Table «Flussgebiet Nr. 6 Aare, Brugg»
Table «Flussgebiet Nr. 7 Reuss, Mellingen»
Table «Flussgebiet Nr. 8 Limmat, Zürich»
Table «Flussgebiet Nr. 9 Rhône, Porte du Scex»
Table «Flussgebiet Nr. 10 Rhône entre Porte du Scex et Genève»
Table «Flussgebiet Nr. 11 Ticino, Bellinzona»
Table «Flussgebiet Nr. 12 Tresa, Ponte Tresa»
Table «Flussgebiet Nr. 13 Poschiavino, Le Prese»
Table «Flussgebiet Nr. 14 Inn, Martinsbruck»
Top (of page)